go2signals go2signal-analyzer
go2signal-analyzer offers manual and automated modulation off-line analysis in a user-friendly way. It provides analysts and operators with a quick display of all modulation-specific information on a few predefined screens. The user does not have to work step by step through the various analysis functions and set up the mathematical operators to analyze the signal.
The result of the signal analysis can be used to identify/document signals or to set up new demodulators and decoders (with go2modem-studio) for go2monitor.
Key Facts
- Predefined analysis windows that deliver fast results
- Offline tool for various file formats
- Combine the expertise of our analysis specialists with your own knowledge.
- Easy to use, perfect for both beginners and experts
- Simple signal selection (frequency and time range)
- Analysis screens for Time, Periodicity, Classification, PSK, OQPSK, QAM, FSK, MFSK, MC-PSK, OFDM
- Demodulator for bit recording
- Waterfall, Spectrum, Histogram, Auto-correlation, Constellation, Scatter etc.
- COTS hardware (computer)
Features
go2signal-analyzer is a toolbox for analyzing recorded signals. It offers general signal processing and visualizations for the interactive analysis of signals. Automated systems that identify emissions, classify signal types and determine parameters are often used for signal analysis. In cases where automated processing fails or does not provide reliable results, manual analysis can be performed. Manual analysis can provide the same information as the automated system, but offers a deeper insight into the signal to understand the results.
With the available signal analysis modules, the user can analyze a variety of signal formats and modulation schemes. The results are visualized in plots that allow the observation of specific signal characteristics as well as the estimation of parameters. To use this application effectively and interpret its results, a solid knowledge of signal processing and modulation techniques is recommended.
Modulation Analysis
PSK

PSK Analysis can be used for manual analysis of PSK modulated signals.
Several diagrams are displayed, which can be used to determine the following values:
- Carrier frequency
- Symbol rate
- Version of the PSK modulation and order
OQPSK

This module provides tools for manual analysis of Offset-QPSK (OQPSK) modulated emissions, similar to the PSK-analysis (see module PSK Signal Analysis). OQPSK is a special case of QPSK (aka PSK-4A), where the Q-branch is shifted (offset) by half a symbol duration relative to the I-branch - before transmission.
The offset reduces the variation of the envelope - compared to a usual QPSK waveform. Moreover the transitions through zero are completely removed. The power spectrum of OQPSK is same as for a usual QPSK.
Initially modulating 2 bits in one symbol, the offset’ed signal modulates 1 bit per half symbol duration, alternating I- and Q-branch per bit.
Metrics are calculated and plotted to enable users to measure the following modulation parameters:
- carrier frequency fc
- symbol rate Rs
QAM

This module provides tools for manual analysis of Quadrature-Amplitude-Modulation (QAM) emissions. QAM is a generalization of PSK with many possible different I/Q constellations. The power spectrum of
Metrics are calculated and plotted to enable users to measure the following modulation parameters:
- carrier frequency fc
- symbol rate Rs
- I/Q constellation
FSK
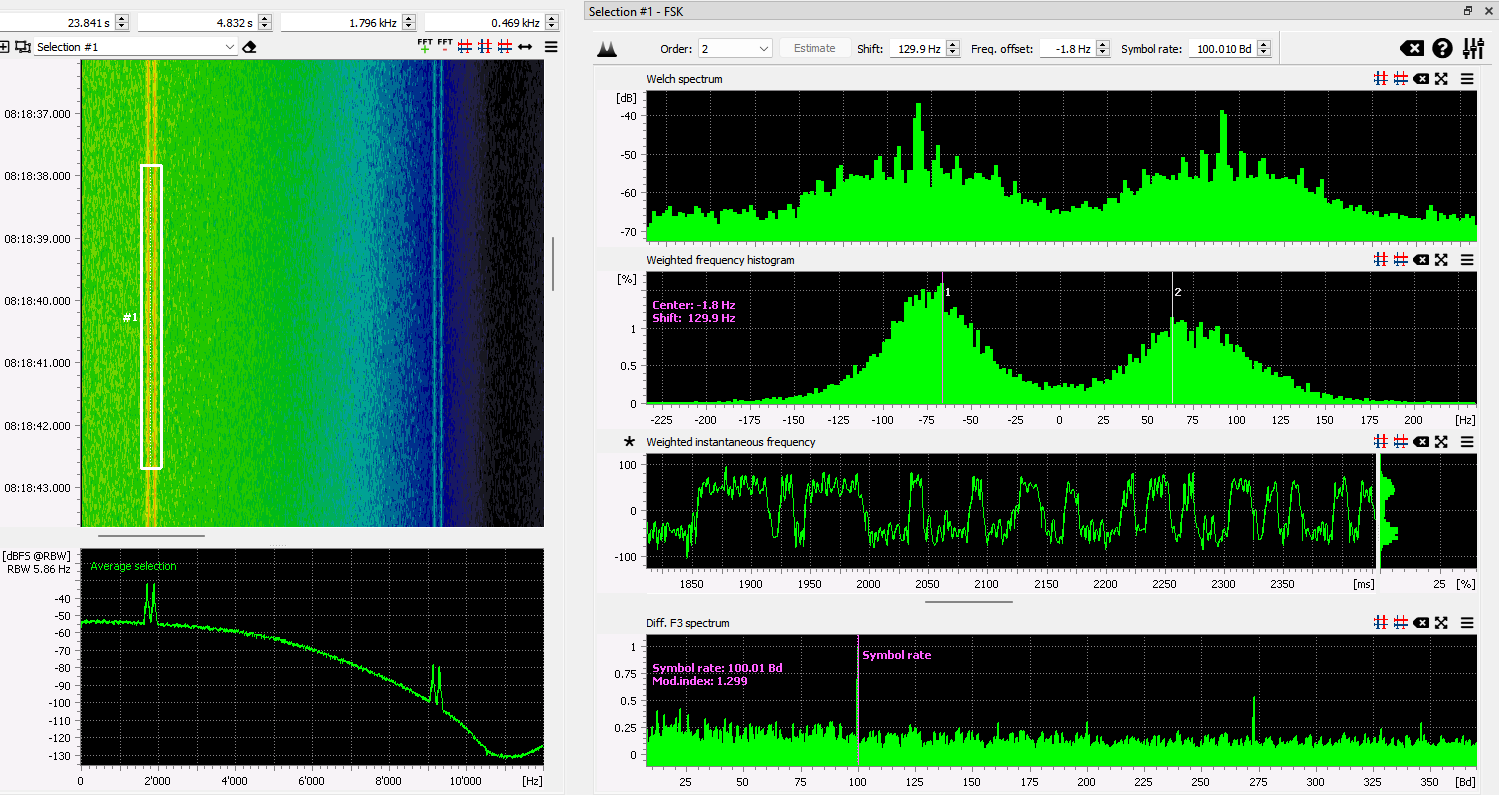
FSK Analysis can be used for manual analysis of FSK modulated signals.
Several diagrams are displayed which can be used to determine the following values:
- modulation order, the number of tones
- Symbol rate
- Frequency-Offset aka center frequency
- Shift, (the frequency spacing of the outer tones).
MFSK

This module provides a tool for manual analysis of emissions using frequency shift keying (FSK) with multiple tones (>= 4). Various metrics are calculated and displayed as plots, enabling the user to determine the parameters of the modulation.
These are:
- symbol rate Rs,
- the number of tones N (>= 4), and
- the tone distance fd between the equidistant tones.
In contrast to the FSK analysis, more than 4 tones can be determined and measured.
MC-PSK/QAM

This module provides plots and measurements for the analysis of multi-carrier PSK/QAM signals. Carrier distance, symbol rate and the constellation used for symbol representation can be determined.
The following assumptions apply for a signal that is being analyzed:
- Carriers are equidistant in frequency
- Symbol rate on all carriers is the same
- Analyzed signal is coherent, i.e. is contain only a single burst or a continuous emission
- There is enough signal available for processing, i.e. at least a few hundred symbols are recommended
The automatic estimation of parameters uses statistical properties of the signal. The analysis performs best on strong (high SNR), undistorted signal. Idle or repeating symbol sequences may lead to confusing analysis results.
OFDM (Optional)

OFDM signals are a special case of multicarrier modulated PSK/QAM signals.
The abbreviation stands for Orthogonal Frequency Division Multiplexing. In this modulation method, symbols that are defined as I/Q values (complex numbers) are distributed over several carriers. This modulation method places symbols that are defined as I/Q values (complex numbers) on multiple carriers.
The analysis performs an automatic estimation of the basic modulation parameters of a modulated OFDM signal. These parameters can be checked by the user and modified if necessary. Selected parameter values can be overwritten, allowing manually controlled demodulation. The results are shown on several displays.
The following assumptions and restrictions apply:
- The analyzed signal is an OFDM or a multi-carrier PSK/QAM signal
- Optimal results can be expected only for OFDM signals employing a cyclic prefix (CP-OFDM)
- There is enough signal available for processing, at least a few hundred symbols are recommended:
- The analysis performs best on strong (high SNR) and undistorted signals.
- Repeating symbol sequences (e.g. idle sequences and pilots) may lead to confusing analysis results.
The following parameters can be measured using the analysis results:
- Carrier distance df
- Symbol rate
- Frequency f0 of carrier zero
- Number of modulated carriers
- Constellation used on each modulated carrier
- Secondary parameters for manually controlled demodulation:
- Sampling position
- Sampling rate error
Additional Functions
Preprocessing
The entries in the “Preprocessing” menu are used to process an input signal before the actual analysis. Some modulation methods require analog pre-processing before go2studio-analyze modules can be used successfully.
- AM is used to remove analog AM modulations
- FM is used to remove analog FM modulations
- Crop is used to reduce the file size so that go2studio-analyze can work faster
Audio

This module offers simple audio playback to give you immediate feedback on the sound.
The adjustable frequency range used is displayed in a separate sonogram. An additional horizontal line shows the current playback position.
The following demodulators are available:
- DIG/CW
- USB
- LSB
- AM
- FM
Time

The Time Analysis module provides various time domain diagrams for manual analysis of basic emission characteristics, e.g. the modulation type of an emission.
The Time Analysis shows three diagrams that can contain:
- Amplitude
- Phase
- Frequency
- Amplitude (I+Q)
- Real (in phase)
- Imaginary (quadrature)
- Power (squared magnitude, lin.)
- Level (log. power)
Periodicity
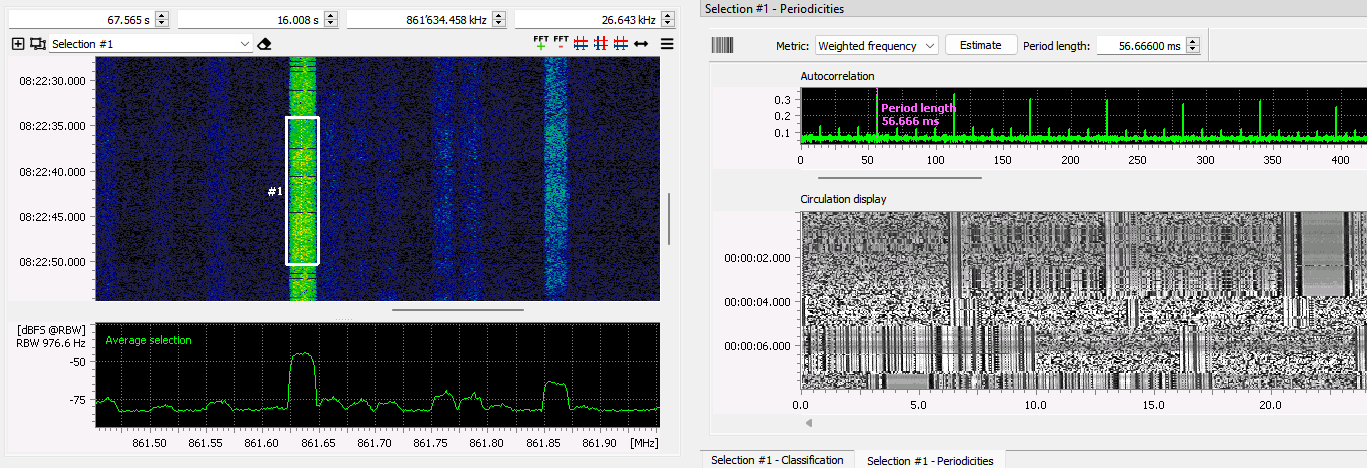
This module enables the detection of repeating components, such as regularly sent synchronization sequences. It offers the possibility to measure the time span between consecutive events.
The analysis is performed depending on the selected metric and an autocorrelation is displayed to immediately detect dominant periods of repeating components.
Repeating sequences become visible in a circular display.
Classification

The classification analysis module runs an automatic signal classification of a selected part of a signal.
All relevant signal parameters are displayed in a table if the classification was successful, otherwise only
generic parameters are displayed.
Demodulation
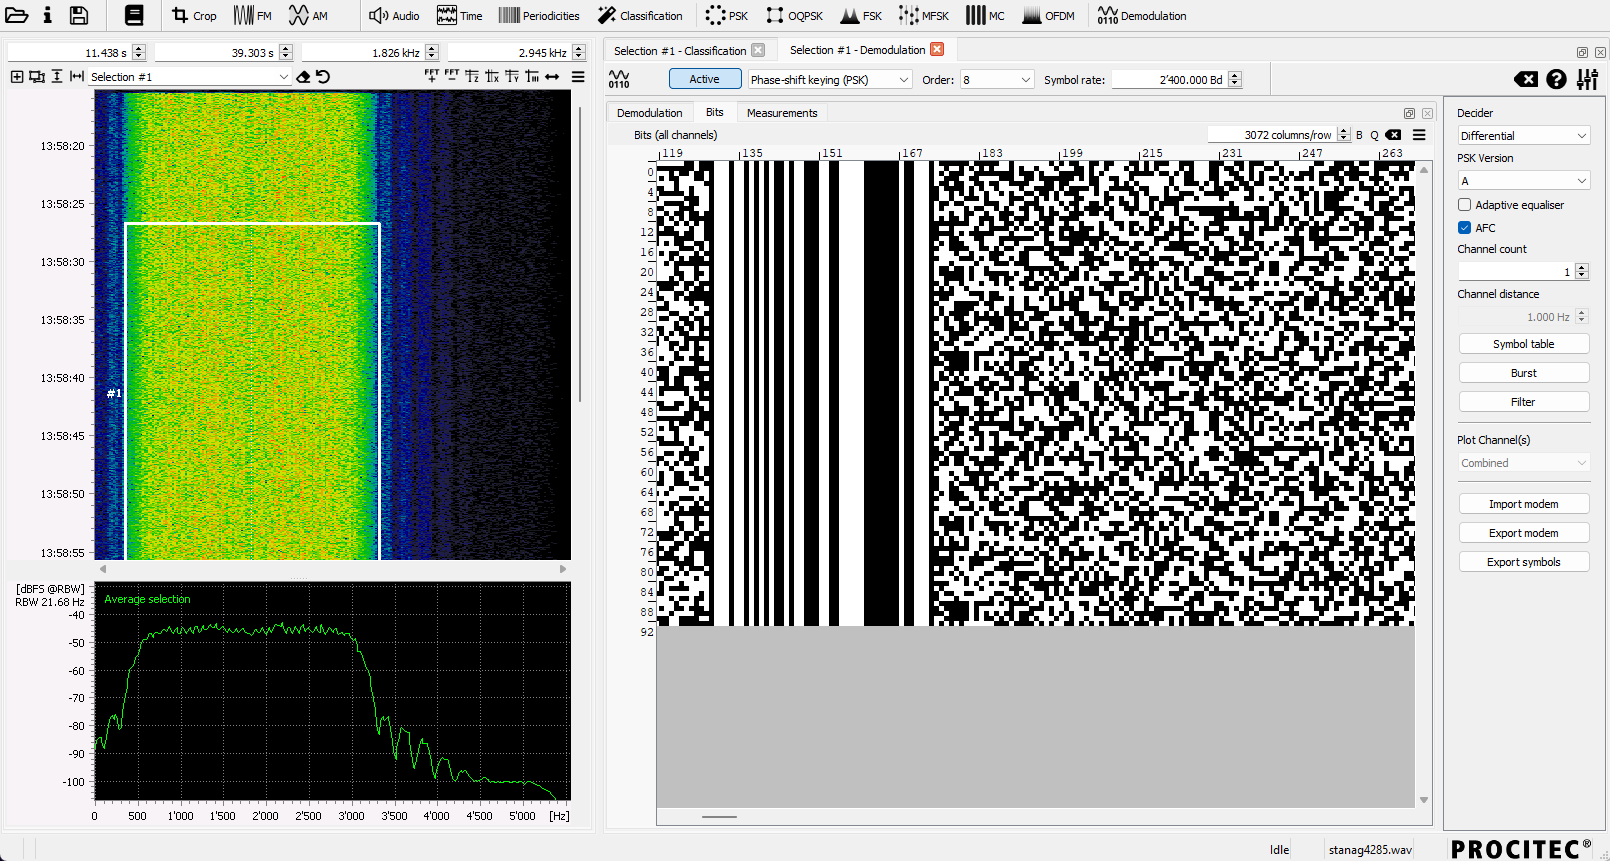
This module provides demodulation functions for various modulation types. The purpose of the module is to visualize the demodulation quality to enable the user to optimize the demodulation parameters
The graphical eye pattern diagram and the I/Q plot give a very good impression of the demodulation quality.
The variety of demodulation parameters requires precise configuration for best results. The output of the demodulator is displayed in a bit/symbol display to allow visual inspection of the data. A more in-depth bit analysis and decoding can be performed in other PROCITEC products after export.
OQPSK
This module provides tools for manual analysis of Offset-QPSK (OQPSK) modulated emissions, similar to the PSK-analysis (see module PSK Signal Analysis). OQPSK is a special case of QPSK (aka PSK-4A), where the Q-branch is shifted (offset) by half a symbol duration relative to the I-branch - before transmission.
The offset reduces the variation of the envelope - compared to a usual QPSK waveform. Moreover the transitions through zero are completely removed. The power spectrum of OQPSK is same as for a usual QPSK.
Initially modulating 2 bits in one symbol, the offset’ed signal modulates 1 bit per half symbol duration, alternating I- and Q-branch per bit.
Metrics are calculated and plotted to enable users to measure the following modulation parameters:
- carrier frequency fc
- symbol rate Rs