- Quickly and reliably monitor the spectrum, even if you don't have time to scroll through thousands of recordings to find some interesting features
- Observe what is going on, also recognize results that may be wrong (wrong detection/decoding) and use this information to improve monitoring tasks or adjust the decoders
- Analyze the received data to find out which frequencies or modems need to be blocked, as the data is not really useful and only blocks your system.
- Identify networks and changes in the networks
shoc Network Analysis

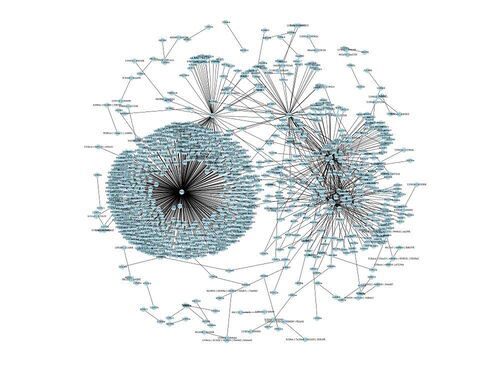
Create node network graphics directly from the go2MONITOR ResultViewer.
A picture is worth a thousand words, it shows you much faster than a table what is going on.
Adaptable for other systems.
The plugin is written in PYTHON and can be customized by us to meet your specific needs.
Key Facts
- go2MONITOR plug-in for go2MONITOR 23.2, an update is required for go2MONITOR 24.1!
- Recognize which stations are working on which frequencies
- Recognize which stations use which type of modems
- Recognize which stations are communicating at what time
- Recognize who is communicating with each other
Your Solution For
Typical Workflow
Select the Data
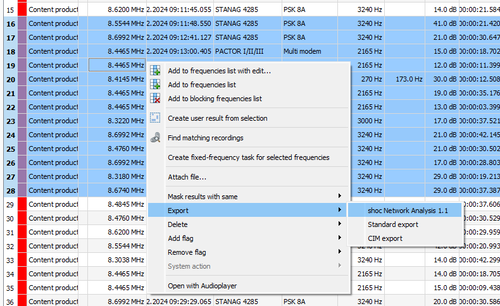
Select the data records to be analyzed in the ResultViewer:
- You can use all available filter techniques such as "Advanced filters", "Structuring" or SQL commands.
- Select the required data records or select all (ctrl-A)
- Select "Export" (button below or right mouse click), then select "shoc Network Analysis"
Select Destination Directory for the Result Files
You must select the directory where the output (PNF and CVS) should be saved.
- Navigate to the folder
- "Press "Select folder"
Analyze the Graphs
After a few seconds, the charts are displayed on the screen.
- If you wish, close it.
- All files have already been automatically saved in the previously selected output directory
The diagram created by the software is approximately 6000 x 6000 pixels in size and requires a lot of storage space.
Sample Screens
Depending on the number of data records, the files (PNG) can become very large (<20 MB). This makes publication on the Internet difficult.
For this reason, we sometimes only show a few details or an overview in reduced resolution.
For this reason, we sometimes only show a few details or an overview in reduced resolution.
You can download a few sample diagrams from our download page.
Under development
- Improved display that can be modified by the user (zoom, rearrangement, highlighting of additional data, etc.).
- Data are saved in a HTML
- Screen shows HFDL data
0%
shoc Network Analysis
- go2MONITOR plug-In
- Easy to use, perfect for both beginners and experts
- Show's the relationships between transmitters, frequencies and modems
- Can be further customized to your needs
- Other tools on request


