go2signals Signal Analyzer
Signal Analyzer offers manual and automated modulation off-line analysis in a user-friendly way. It provides analysts and operators with a quick display of all modulation-specific information on a few predefined screens. The user does not have to work step by step through the various analysis functions and set up the mathematical operators to analyze the signal.
The result of the "signal analysis" can be used to identify/document signals or to set up new demodulators and decoders for go2DECODE/go2MONITOR.
Key Facts
- Analysis windows that offer direct support for all necessary analysis methods
- Use the expertise of our analysis specialists in combination with your knowledge
- Easy to use, perfect for both beginners and experts
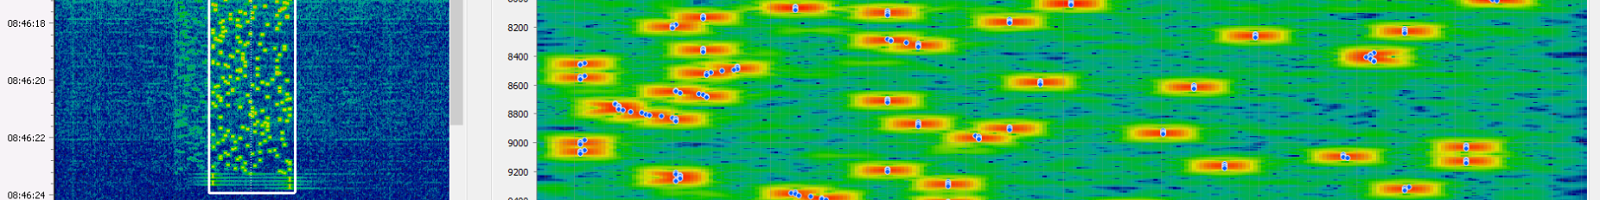
- Simple signal selection (frequency and time range), similar to "cropping" an image
- Analysis screens for Time, Periodicity, PSK, FSK, Multi-CH PSK/QAM OFDM
- Waterfall, Spectrum, Histogram, Auto-correlation, Constellation, Scatter etc.
- COTS hardware (computers, receivers)
Technical Data
Functions, GUI, Setup
| Parameter | Signal Analyzer Specification |
|---|---|
| Data Acquitision | IF/AF recordings (real / complex WAV 8, 16, 32 Bit, TCI cap file format) |
| Documentation | PDF user manual, PDF online help |
| GUI | Easy and intuitive to operate Input spectrogram Manual and automatic demodulator and decoder control Predefined screens with the most frequently needed displays for quick measurements Displays support both experts and beginners in modulation analysis |
| ISO 9001:2015 | The company is certified |
| License | USB-Dongle (CodeMeter) License sharing with license server |
| Localisation | English |
| OS | Windows 10/1 64 bit de/en CentOS Linux 7 (7.5 or higher, 7.5 recommended), 64 bit Red Hat Enterprise Linux RHEL 8 (8.4 or higher, 8.4 recommended), 64 bit |
| PC hardware | Min. Intel I5 , min 2.6 GHz Memory: min 2 GB RAM HDD: min. 10 GB Screen Resolution: min. 1280 x 1024 pixel (1920 x 1080 recommended) |
| Training | Training: 1-2 days |
| Analysis Autocorrelation | Autocorrelation Modul |
| Analysis Display | Autorange and zoom function Spectrogram / Sonagram Spectrum (linear, logarithmic, average, Welch, A3, F3, nth power, etc.) Vector/time (amplitude, phase, frequency, etc.) Histogram (phase, frequency, etc.) I/Q plot (absolute, differential) Autocorrelation (input data, frequency, amplitude, weighted frequency) Circulation/Hell (frequency, amplitude, weighted frequency, etc.) |
| Analysis FSK | A set of tools, for the analysis of FSK-modulated signals Welch spectrum Weighted frequency histograms Weighted instantaneous frequency Diff F3 spectrum |
| Analysis Multi Carrier PSK/QAM | A set of tools, for the analysis of MC PSK and QAM modulated signals Estimation of the number of carriers via autocorrelation Average spectrum with channel position markers Carrier A3 spectrum (for symbol rate measurement) Carrier differential phase display |
| Analysis Multi Carrier PSK/QAM | A set of tools, for the analysis of MC PSK and QAM modulated signals Estimation of the number of carriers via autocorrelation Average spectrum with channel position markers Carrier A3 spectrum (for symbol rate measurement) Carrier differential phase display |
| Analysis Multi-Tone FSK (MFSK) | A set of tools, for the analysis of MFSK modulated signals Estimation of the number of carriers |
| Analysis Periodicity | Used to detect repetitive signal parts, such as regularly transmitted synchronization sequences, bit frames, etc. Analysis functions using instantaneous frequency, weighted frequency, differential phase and magnitude Autocorrelation display for measuring the repetition propagation time Circulation display synchronized with autocorrelation measurement |
| Analysis PSK | A set of tools, for the analysis of PSK-modulated signals Display of multiple squared signal spectra with automatic frequency correction 8'th power spectrum of phase (for center offset frequency measurement) Differential phase histogram Absolute I/Q display Differential I/Q display A3 spectrum (for Baud rate measurement) |
| Analysis Symbol Rate | Symbol Rate Modul |
| Analysis Time | Various time domain diagrams for evaluating basic modulation characteristics Originally configured to compare magnitude, phase, and frequency over time Additional selection of amplitude, in-phase, quadrature, power and level Each plot contains an additional histogram |
| Audio Demodulator and Player | |
| Classifier | Automatic modulation and modem classification of a signal included in a selection. Details see separate tables. |
| Crop Tool | Function to "cut" a specific part from an input file (using DDC) Possibility to swap lower and upper sideband The output is displayed as a sonogram/spectrum and can be used for further analysis |
| Cursor | Various cursors are available for parameter measurements, matched to the display: * X, Y, Z, XY cursor * Harmonic, centered and mirrored multiple cursor mode * Time, frequency, phase, amplitude, symbol rate, bandwidth, SNR, channel count, channel spacing, etc. measurement |
| Demodulator AM | Function to remove a primary AM modulation Possibility to swap lower and upper sideband The output is displayed as a sonogram/spectrum and can be used for further analysis |
| Demodulator FM | Function to remove a primary FM modulation Possibility to swap lower and upper sideband The output is displayed as a sonogram/spectrum and can be used for further analysis |
| Signal Informationen Database | |
| Signal Selection | Manual selection of the signal components to be analyzed (time and frequency domain) Multiple selection possible for comparison |
| Option - OFDM Analysis and Demodulation | A set of tools for analysis and demodulation of OFDM modulated signals Automatic parameter estimation for user friendly analysis Autocorrelation for Tu-duration measurement Autocorrelation for Ts duration measurement Various displays regarding clock recovery, sampling position, frequency offsetand sampling position Carrier scatter displays for differential phase, absolute phase and linear amplitude Time scatter plots for differential phase, absolute phase and linear magnitude Absolute and differential multicarrier I/Q display Decision-controlled absolute and differential PLL demodulation for PSK2, PSK4, PSK8, PSK16, QAM4 and QAM16 Absolute and differential multi-carrier soft decision I/Q display Bit display for demodulation result Special multicarrier mode PSK/QAM with phase and pulse shape correction Export of analysis result to go2MONITOR and go2DECODE as modem description or demodulator parameter file |
Classified Modulations
| Modulation | HF | VHF, UHF | Eb/No | |
|---|---|---|---|---|
| Eb/No | detection rate > 90% false alarms < 1% |
|||
| min. Signal lenth | 100 symbols | 100 symbols | ||
| max. signal bandwidth | 50 kHz | 50 - 80 % of input bandwidth | ||
| Signal energy detection, min. SNR | 6 dB | 6 dB | ||
| min. signal length | 100 ms | 100 ms | ||
| Measurement conditions | 4 sec | 4 sec | ||
| Analog modulation types (no SELCALS) | USB J3E LSB J3E AM A3E DSB-SC (optional) |
USB J3E LSB J3E AM A3E DSB-SC (optional) NFM F3E (f> 25 MHz) WFM (BW 50-300 kHz, 65-108 MHz) |
||
| ASK2/4 | Signal frequency > 300 MHz | 1.2 - 25 kBd | 20 dB | |
| FSK2 | m = 1 - 10 | 25 - 4800 Bd | 1.2 - 25 kBd | 11 - 15 dB |
| FSK2 | m = 0.75 - 1.5 | 25 - 75 kBd | > 25 dB | |
| FSK4 | shift>SR | 25 - 4800 Bd | 1.2 - 25 kBd | 14 - 16 dB |
| GMSK | m = 0.5 | 300 - 4800 Bd | 1.2 - 125 kBd | 14 - 16 dB |
| MC FSK2 | m >= 1 2 - 64 CH |
40 - 250 Bd 120 - 1000 Hz CH spacing (min. 2xshift) |
40 - 250 Bd 120 - 1000 Hz CH spacing (min. 2xshift) |
17 dB |
| MC PSK 2, 4 A/B MC DPSK 2, 4 A/B |
< 10 kHz signal bw 2 - 64 ch |
31.25 - 250 Bd 50 - 300 Hz channel spacing |
31.25 - 250 Bd 50 - 300 Hz channel spacing |
13 - 15 dB |
| MORSE | 30 - 250 CPM | 30 - 250 CPM | ||
| MSK | m = 0.5 | 100 - 4800 Bd | 1.2 - 125 kBd | 14 - 16 dB |
| Multitone FSKn | 5 - 64 tones (shift >sr) |
3 - 200 ms (5 - 330 Bd) |
3 - 200 ms (5 - 330 Bd) |
14 - 16 dB |
| OFDM | Bandwidth < 50 kHz: 25 - 512 Bd Tg/Tu 0.125 -1 max. 250 Hz channel spacing min 25 Bd with PSK2 or PSK8 modulation |
Bandwidth < 50 kHz: 25 - 512 Bd Tg/Tu 0.125 -1 max. 250 Hz channel spacing min 25 Bd with PSK2 or PSK8 modulation Bandwidth 50 kHz - 12.5 MHz: 128-32768 channels Tg/Tu 0.625-0.25 max. channel spacing 15 kHz min 50 Bd (PSK2 or PSK8) |
14 - 18 dB | |
| OQPSK | within Freq. Ranges 1545-1551 MHz 3600-3629 MHz |
2.4 kBd - 500 kBd | 15 dB | |
| OTH Radar | FM-CW variants only | detection only | ||
| PSK 2 A/B DPSK 2 A/B |
31.25 - 4800 Bd | 1.2 kBd - 50 MBd | 7 - 10 dB A/B Decision: 8 - 15 dB |
|
| PSK 4 A/B DPSK 4 A/B |
31.25 - 4800 Bd | 1.2 kBd - 50 MBd | 8 - 12 dB A/B Decision: 10 - 15 dB |
|
| PSK 8 A/B DPSK 8 A/B |
31.25 - 4800 Bd | 1.2 kBd - 50 MBd | HF: 8 - 12 dB A/B Decision: 10 - 15 dB VHF, UHF: 10 - 14 dB A/B Decision: 12 - 15 dB |
|
| PSK16 | 300 - 4800 Bd | 1.2 kBd - 50 MBd | 14 - 16 dB | |
| QAM | Order: 16, 32, 64 Rectangular constellations only |
1600 - 4800 Bd | 1.6 - 25 kBd | 22 dB |
Classified Modems
| HF | VHF / UHF |
|---|---|
| ALE 3G | ACARS-VHF |
| ALE 4G | APCO-25 |
| CHN 4+4 | APCO-25 Phase 2 Downlink |
| CHN hybrid | DAB |
| CIS-112 | DECT |
| CIS-128 | DMR |
| CIS-45 (33 / 45 Bd) | DMR Continuous |
| CIS-60 | dPMR |
| CIS-93 | D-STAR |
| CIS-AKULA | DVB-T (8 MHz Mode only) |
| CODAN 3012 16 Channel PSK | FLEX |
| CODAN 3212 16 Channel PSK | GSM (<3G), UMTS, LTE |
| HFDL | Inmarsat Satphone Uplink |
| LINK11 (CLEW & SLEW) | Iridium Satphone Uplink |
| LINK-22 | MPT1327 1200Bd |
| MIL-STD-188-110A Serial (STANAG 4539 ) | NXDN |
| MIL-STD-188-110B/C App. C (STANAG 4539 HDR ) | TETRA Downlink |
| MIL-STD-188-110C App. D | TETRA Uplink |
| PACTOR (I, II, II FEC, III, 4) | TETRAPOL |
| STANAG 4285/4481 (PSK) | Thuraya SAT Phone Uplink |
| STANAG 4529 | VDL2 |
| STANAG 4539 | Yaesu System Fusion |